


FormVault
Two systems for one dataset: a public catalogue and the admin behind it
FormVault is a platform for managing and distributing 3D furniture models for architects and interior designers. We designed the full-stack MVP: twenty screens across two connected systems, delivered in five milestones from wireframe to hi-fi prototype and scoped for a catalogue in the tens of thousands.
Design of a full-stack MVP. Scope locked, milestones accepted, ready to build.
01The challenge
Where it started.
For an architect, finding a 3D model of a specific chair means visiting manufacturer sites one by one, each with its own naming, its own formats and its own idea of a category. The work is not modelling, it is searching, and it repeats on every project.
In detail
On the other side of the same dataset sits a problem nobody sees. Whoever publishes those models has no view of what is live, what is waiting for review, what is hidden and what is being downloaded. Without statuses and numbers, a growing catalogue is managed from memory and email.
A catalogue project therefore quietly contains two products, and their scope needs to be visible before anyone starts coding. Twenty screens designed against a catalogue sized in the tens of thousands is what makes that scope a decision instead of a discovery halfway through the build.
Quote
“A catalogue project quietly contains two products. Putting both in one prototype makes that visible before anyone signs anything.”
02What we built
The product, screen by screen.
The design principle throughout: one dataset, two audiences, and neither of them gets a compromise.
The product
Both halves of one dataset
The admin dashboard and the public catalogue, from the handed-over hi-fi prototype. The figures on the screens are sample data.
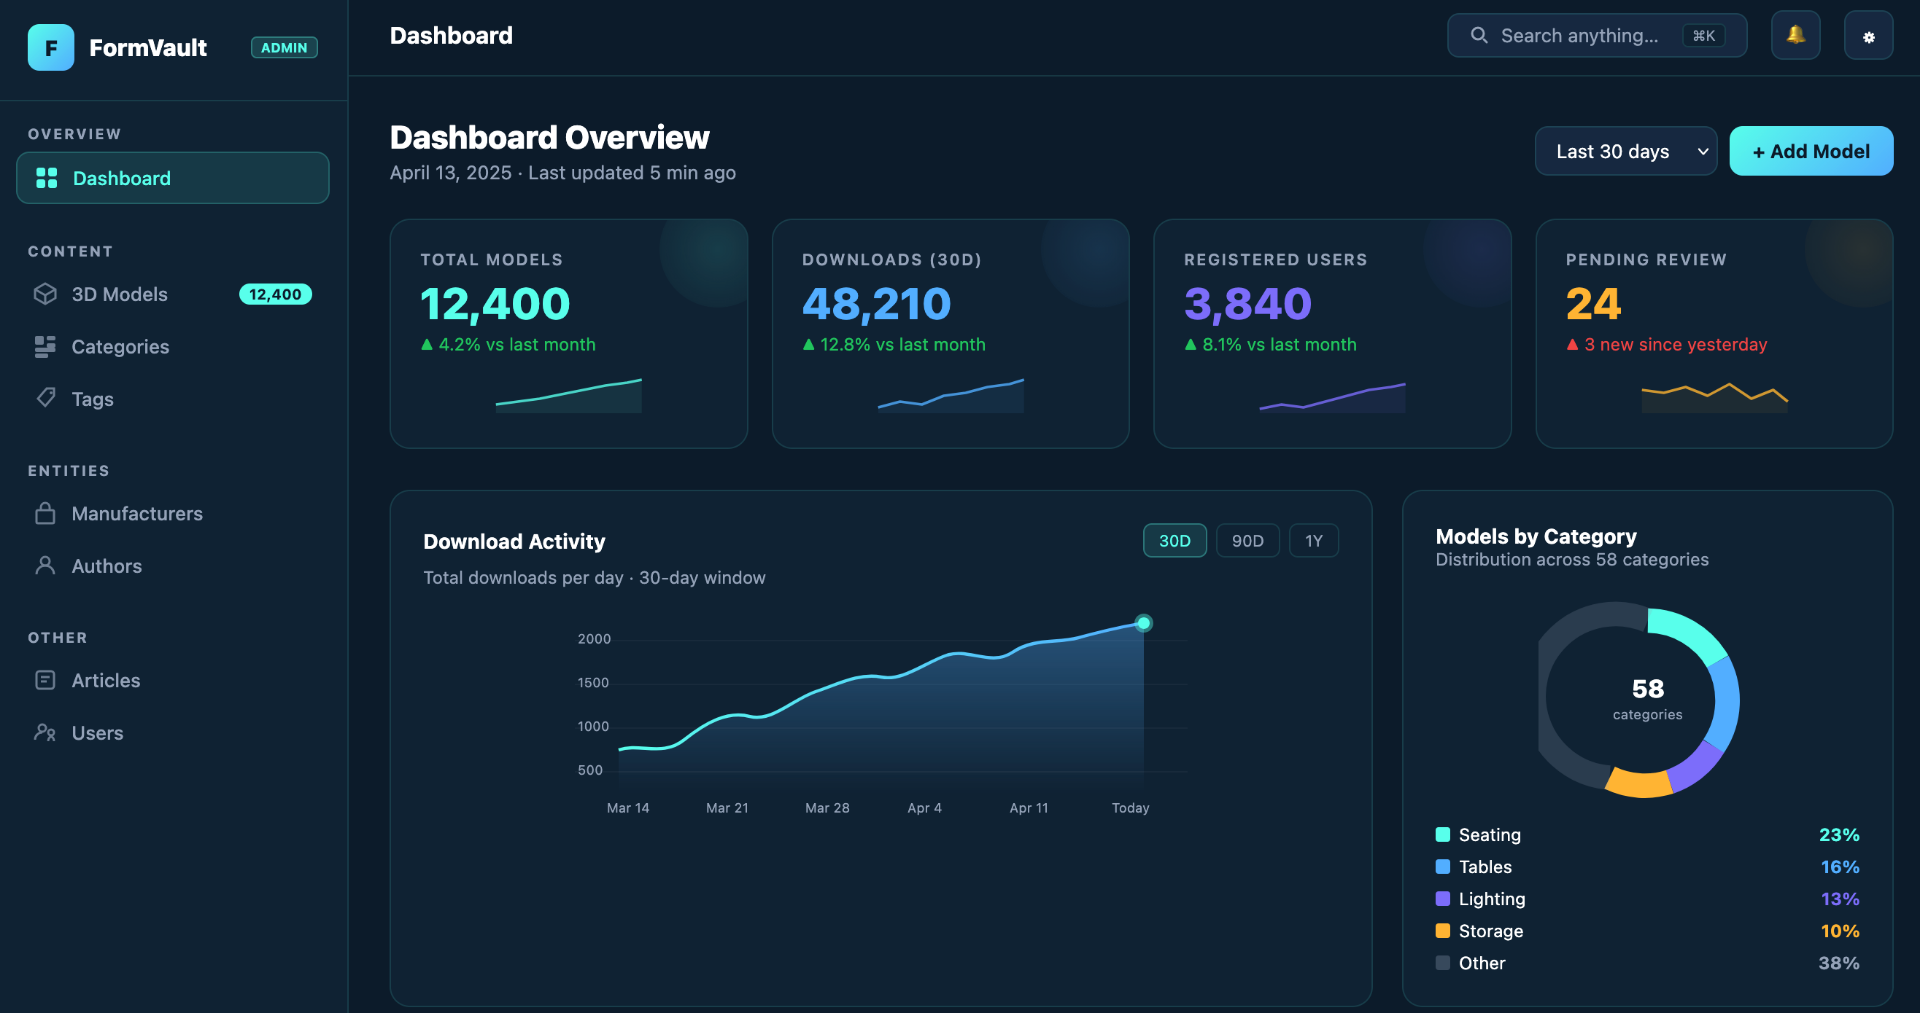
Admin dashboard: KPI cards, download trend, category donut 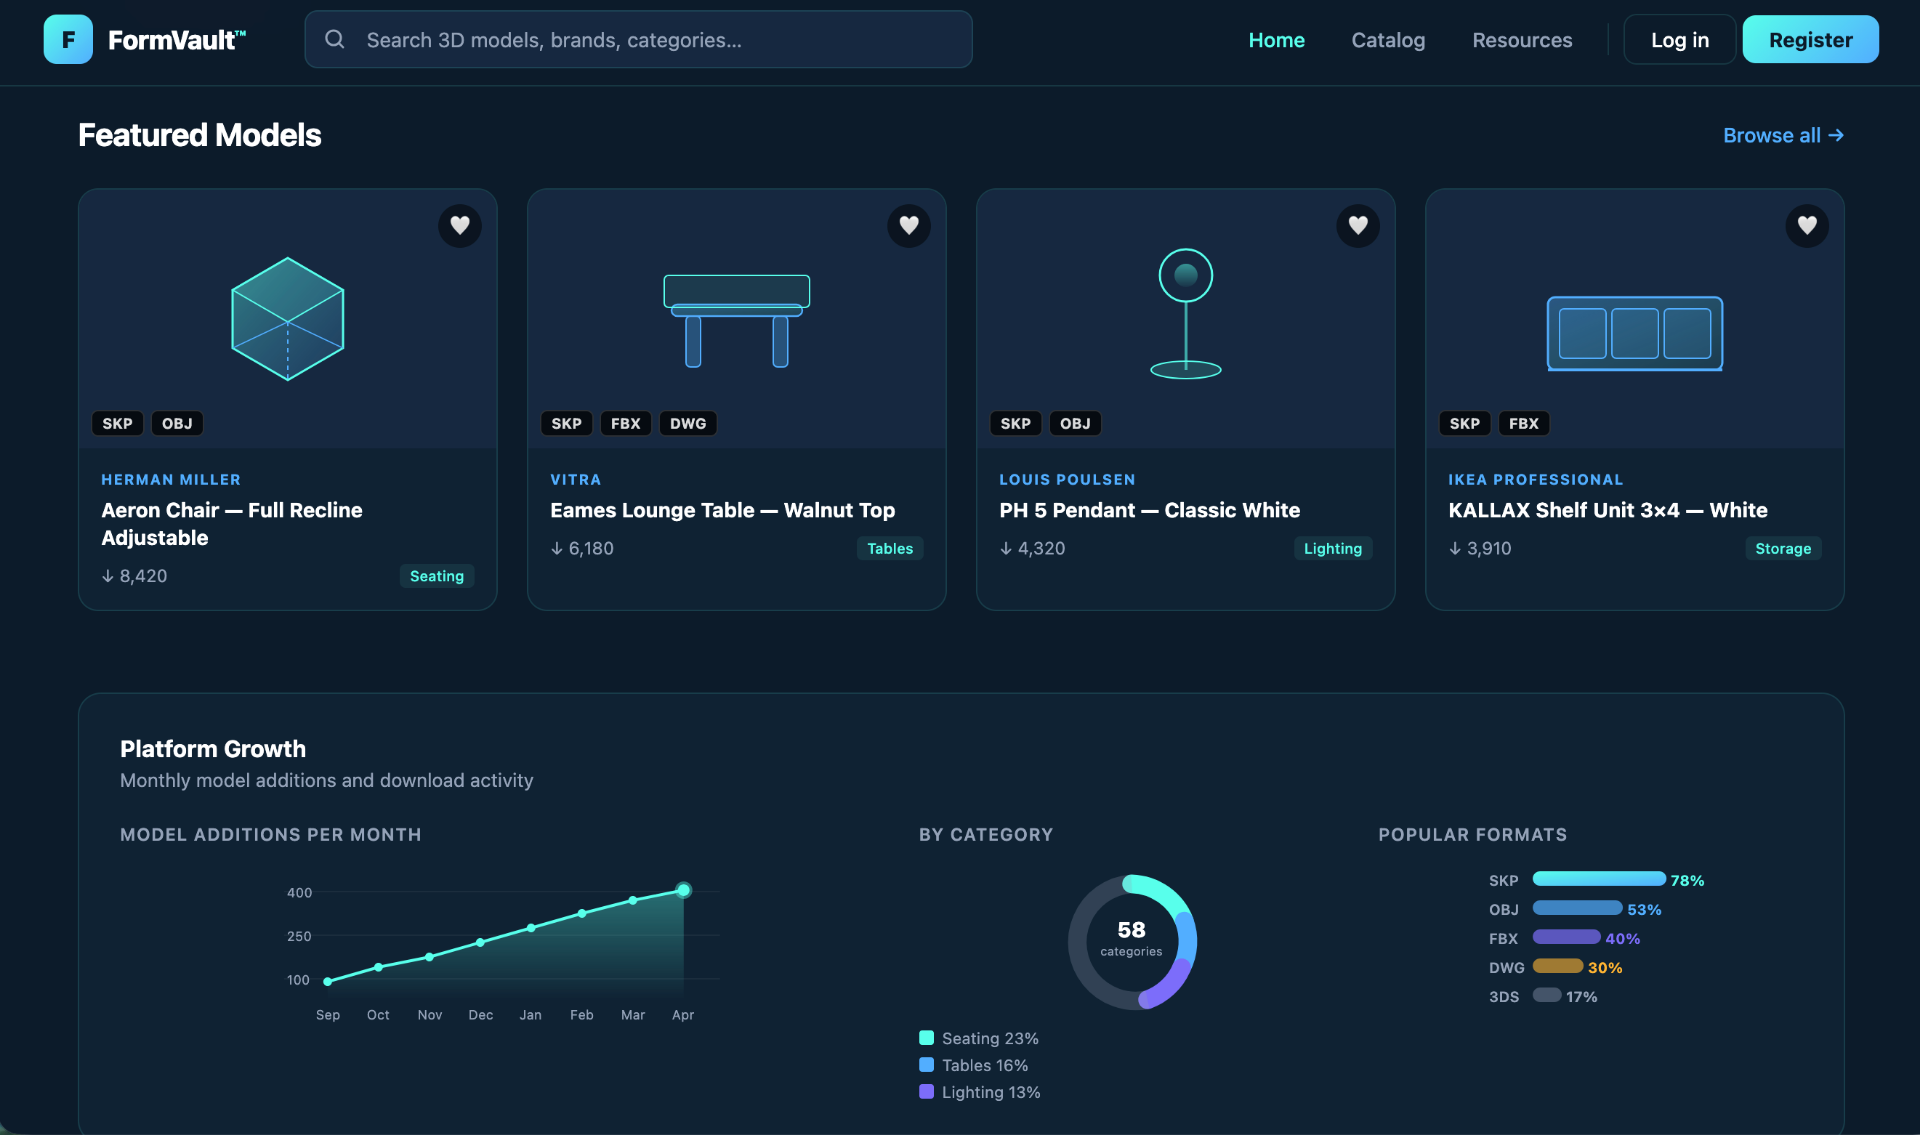
Public catalogue: model grid with category filters and search
Screens from the hi-fi prototype. Model counts and download figures are sample data, not measured results.
Why this design
Search that expects a typo
The public catalogue runs on Typesense with instant results and fuzzy matching, plus filter chips by category, manufacturer and rating. At catalogue scale, exact-match search is the same as no search.
An admin that answers with numbers
Four KPI cards (models, downloads, users, pending), an area chart of the download trend and a donut of category split. The point is not decoration: it is that the person running the catalogue can see what is happening without asking anybody.
Statuses, not a folder of files
Every model moves through published, draft, pending and hidden, with colour-coded badges, bulk actions and inline editing in a sortable table. Upload accepts OBJ, FBX and GLB, so the same record serves several formats instead of several records serving one.
03Rollout
Step by step.
Twenty screens were delivered in five milestones, from wireframe to hi-fi prototype, each accepted before the next began. The public side covers the model grid with category chips, search, and a detail page with a 3D preview. The admin side covers the KPI dashboard, the models table with filters and bulk actions, the edit form with multi-format upload, categories and tags, and manufacturer and author management.
How it runs
Nothing here is deployed. The model counts, download figures and chart data on the screens are sample values used to show the format of the interface at realistic scale, not measured results. The deliverable is a design ready to code, with the scope locked.
In practice
The catalogue owner opens the dashboard, sees five models pending review and the download trend for the week, filters the table to pending, edits two records inline, publishes them, and the public grid picks them up. An architect on the other side searches a misspelled model name and still finds the chair.
04Results
What changed.
This is a design handover, not a deployment, so there is nothing running to report on. What was delivered and accepted is this.
- Twenty screens across two connected systems, catalogue and admin
- Five milestones, each accepted before the next started
- Full-text search with fuzzy matching and filters by category, manufacturer and rating
- A KPI dashboard with a download trend chart and a category donut
- Multi-format upload (OBJ, FBX, GLB) with a metadata editor and status workflow
- Hierarchical categories, custom tags, manufacturer profiles and author management
Why it worked
Designing both systems together is what made the scope a decision. A client looking at twenty screens can see which half is worth building first, and that conversation is impossible when only the public side has been drawn.
The screens were designed against a realistic catalogue size rather than a demo of a dozen items. Pagination, bulk actions, filters and search behave differently at scale, and a design that ignores that has to be redrawn as soon as real data arrives.


Next step
Your process could be the next case.
A 30-minute call. You tell us about one process, and we say whether it fits the platform, a product build or a consulting project.