


Insurance company
Underinsured contracts turned into a call list, sorted by gap
An intermediary held property policies from ten insurers in ten different formats. Converting every sum insured to one comparable unit and checking it against market prices produced a ranked list of clients worth calling, each with evidence attached.
Ten formats in. One ranked call list out. Every entry with a market listing attached as proof.
01The question
Where it started.
The intermediary manages property policies issued by ten different insurers. Each uses its own contract structure, its own coverage labels and its own set of fields. What one policy calls a family house with outbuildings, another calls a main structure and a third simply a building.
In detail
Two risks sat inside that portfolio, both invisible. Property prices have moved, so a sum insured agreed a decade ago often no longer matches reality, which means a reduced payout at claim time. And every such contract is a reason to call the client that has actual substance.
Neither could be acted on, because nobody could produce the list. The data sat in inconsistent formats, and comparing against market prices would have meant looking up listings for every municipality by hand.
Quote
“We were not missing data. We were missing one number that made ten different contract formats comparable to each other.”
02How we approached it
How we worked.
The goal was never a score or a model. It was a list an agent could pick up and act on the same day.
Why this approach
One comparable unit
A sum insured on its own says nothing across ten insurers. Converting everything to insured value per square metre removed the inconsistency between formats and object types in a single step.
Evidence the client can check
For each municipality the current price per square metre was collected together with the three most relevant listings. The agent does not argue from an estimate, the client can open the link.
A threshold that filters noise
Below ten percent the difference cannot be separated from ordinary market variance. Above it, the call has substance. One clear line decided what entered the output and what did not.
03The method
Step by step.
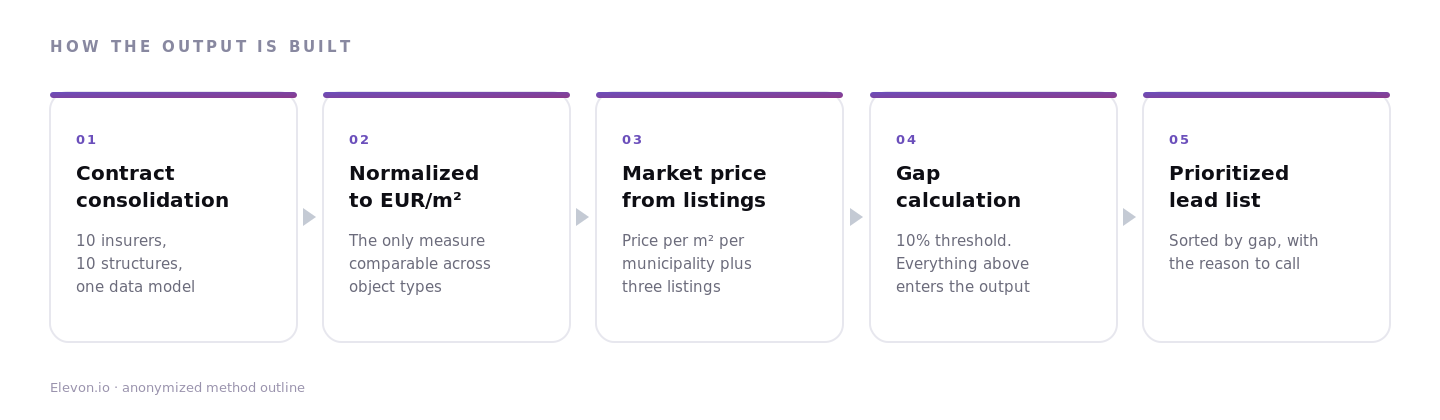
Contracts from ten insurers were mapped onto a single data model: insurer, start date, object type, municipality, floor area, year of completion, sum insured and annual premium. Every sum insured was then converted to value per square metre.
How it runs
Market price per square metre was collected for each municipality in the sample, with links to three listings. Contracts above the ten percent gap were ranked from largest gap down, with the scale of additional cover estimated and a suggested reason to call.
In practice
The sample contained policies covering household contents only, while the apartment or house itself was left uninsured. In a manual review that is easy to miss, because the policy formally exists and the premium is being paid every year.
04What we found
What changed.
The source sample contains personal client data, so every example used publicly is synthetic. The figures below describe the shape of the finding, not individual contracts.
- Insured value per square metre varied by almost two and a half times across the sample
- Contracts found covering household contents only, with the property itself uninsured
- Every flagged contract paired with three market listings from the client's own municipality
- The oldest contracts produced the widest gaps, giving a clear campaign sequence
- A ranked call list an agent can work through without further preparation
Why it worked
The output was not a model or a score, it was a list. That distinction matters, because a score has to be explained to the person making the call, while a ranked list with evidence attached can simply be worked through.
Converting to one comparable unit did the heavy lifting. Ten insurers, five object types and a decade of contracts became a single column of numbers that can be sorted, and everything after that was straightforward.
Quote
“Sequence by contract age, not by premium size. The oldest policies are where the gap has had the most time to open.”


Next step
Your process could be the next case.
A 30-minute call. You tell us about one process, and we say whether it fits the platform, a product build or a consulting project.